
Making a pragmatic Azure storage cost estimate
You can also watch the video: https://youtu.be/dJwCOATCAZg
Data has become the ‘new production factor’. The growing importance of data has led to an explosion of data storage and in connection with this, storage costs have become a determining cost factor in Azure quotations. I see an increasing number of quotes where the storage costs are higher than the compute costs.
This data explosion is why Azure offers a rich and growing scale of storage solutions to offer the best price / performance to store this growing amount of data efficiently, reliably and at the lowest possible cost.
An Azure managed disk is a virtual hard disk (VHD). You can think of it like a physical disk in an on-premises server but, virtualized. Azure-managed disks are stored as page blobs. It is called a managed disk, ‘managed’ because it is an abstraction over page blobs, blob containers, and Azure storage accounts.
Azure Managed disks are designed for (5*9) 99.999% availability. Azure managed disks achieve this by providing you with three replicas of your data, allowing for high durability.
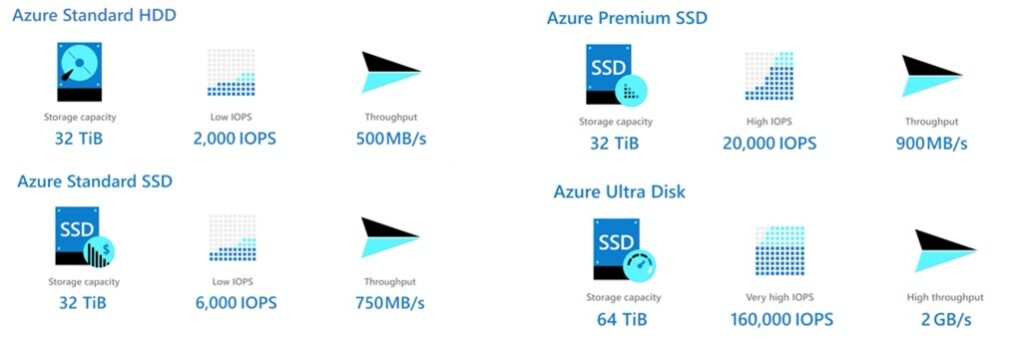
In the above graph you see the main four types of “Azure managed disks”. Every type has a range of disks, with different size from 4GiB up to 64 TiB. Bigger sized disks gives more IOPS. A unique Azure option is that you can attached a combination of different type of disks to a VM, depending on the nature of the storage requirement.
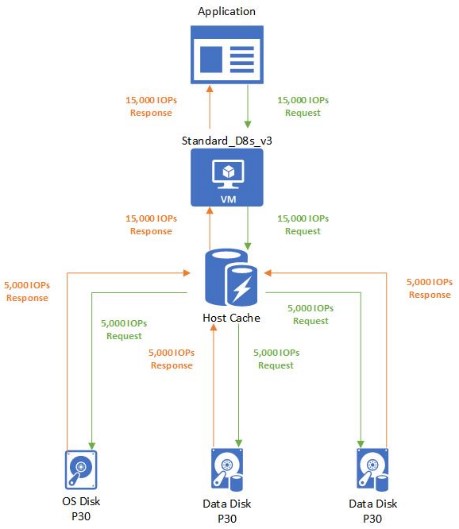
By mounting multiple disks parallel, the IOPS requirement of the application can be met, because the IOPS of single disks are counting up.
The Azure managed disk provisioning is flexible. You can give disks names, change drive letter, mount one disk to multiple VM’s, mount different disk types to one VM. With this mix of options you can optimize price performance.
The initial set-up of the storage mix is done during the migration phase itself, the optimization is done in the first months of tuning the Azure implementation based on measured performance and throughputs.
It is a waste of time to try to do this in the assessment phase and in the making of a proposal.
Here’s a screen shot from the Smart Azure Calculator. In the right top you see the volume of Primary storage split between HDD and SSD. Customer HDD disk capacity is match with the managed Azure HDD. In terms of IOPS and throughput in 99% of the cases this is at least equal and to stay competitive take this comparable approach as starting point and not offering more IOPs then the customer is having today. Why should you do that?
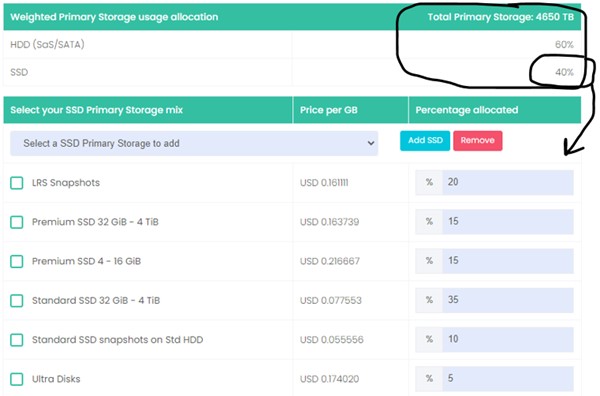
In the Smart Azure Calculator we offer the possibility to create a mix of storage options on an aggregated level and giving the average price per GB per type to estimate the cost with. As you can see that the average price is between 12 to 15 dollar cent per GB over all the SSD options.
With this approach you show the customer the richness and the flexibility of the Azure storage options and make them better aware of the pricing differences of the Azure storage options. With this aggregated approach the storage cost estimate is accurate.
What applies for the Primary storage also applies for the back-up storage, a rich choice of options. Depending on how much the back-up volume compare to the Primary storage is influencing how much of the back-up storage is distributed over the cheaper Cool and Archive. Same with tape back-up which is comparable with Archive, etc.
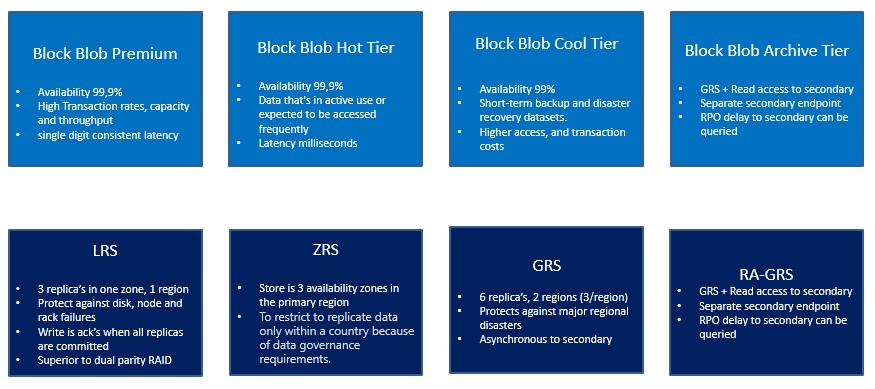
LRS is default. If the Customer has a second location to push backup data too, then GRS is applicable.
Still way better then any customers solution, because which customer is holding 3 or even 6 copies of its back-up.
Here the way the rich choices of the back-up options is implemented in the Smart Azure Calculator to make accurate calculations. In the right top the amount of back-up volume is shown.
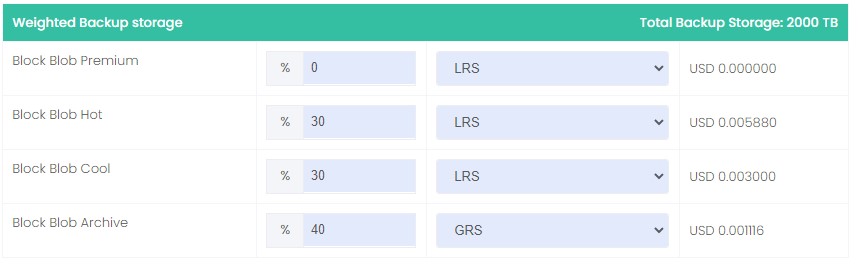
The different options are shown with the price per GB displayed. Making clear to the customer that there are significant price differences and by making the right choices he can save a lot of money
Here the summary of the storage cost as presented to the customer in the Smart Azure Calculator.
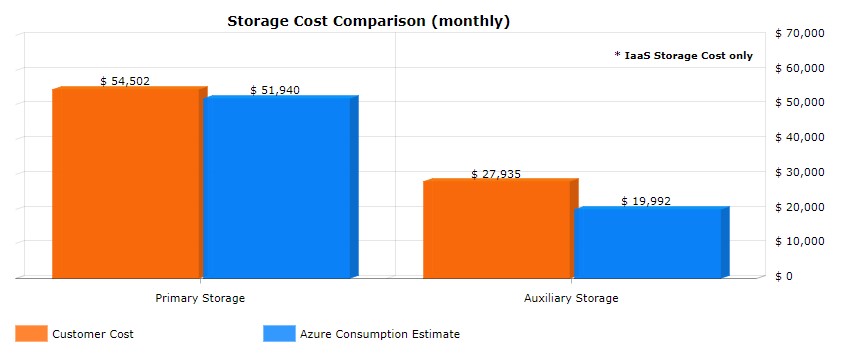
As CloudLab we have run more over 800 Azure consumption estimates. The matter of detail as presented in the graph, plus the given explanation and tables how the price estimate is build-up, is convincing IT management and the DMU what the storage cost estimates will be on Azure.